Kairos™
CCI - Commodity Channel Index
The CCI is designed to detect beginning and ending market trends and ranges from 100 to -100. CCI values outside of this range indicate overbought or oversold conditions. You can also look for price divergence in the CCI. If the price is making new highs, and the CCI is not, then a price correction is likely.
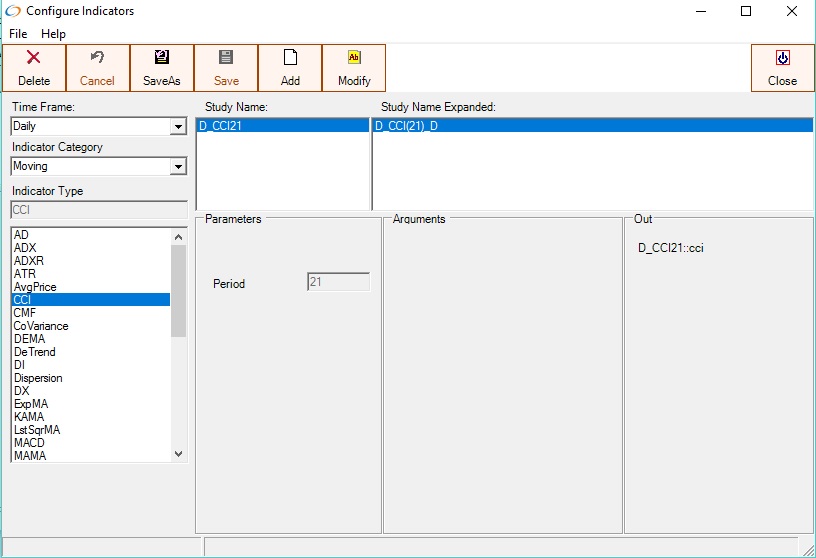
The Commodity Channel Index(CCI) with a Period of 21
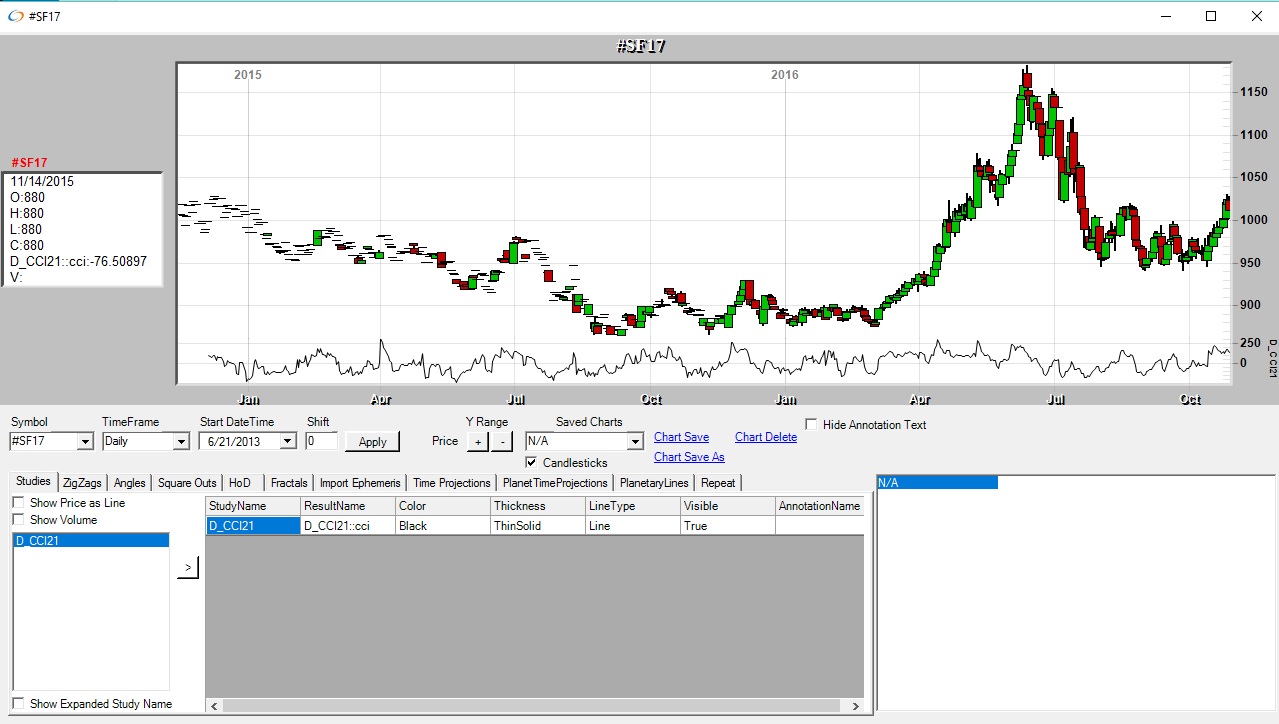
CCI with a period of 21 on the Daily Chart
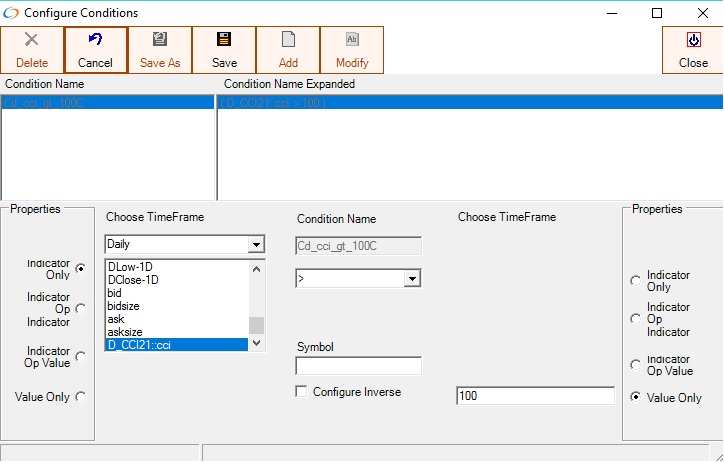
The CCI indicator can be used in conditions - The above condition tests for CCI on the daily timeframe greater than 100