Kairos™
ChaikinAD - Chaikin Accumulation / Distribution
The Accumulation/Distribution Line sums the volume times +1/-1 based on whether the close is higher than the previous close. The Accumulation/Distribution indicator, however multiplies the volume by the close location value (CLV). The CLV is based on the movement of the issue within a single bar and can be +1, -1 or zero.
The Accumulation/Distribution Line is interpreted by looking for a divergence in the direction of the indicator relative to price. If the Accumulation/Distribution Line is trending upward it indicates that the price may follow. Also, if the Accumulation/Distribution Line becomes flat while the price is still rising (or falling) then it signals an impending flattening of the price.
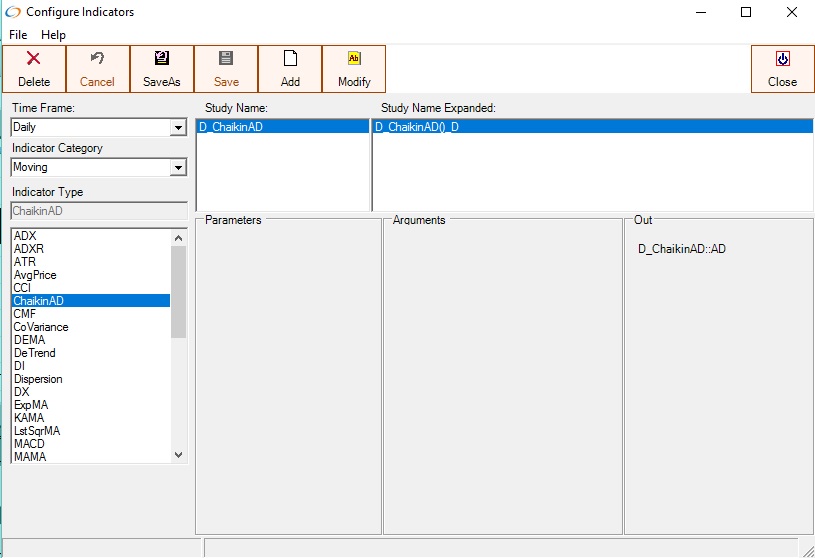
The Chaikin Accumulation/Distribution(ChaikinAD) indicator on the daily chart Timeframe
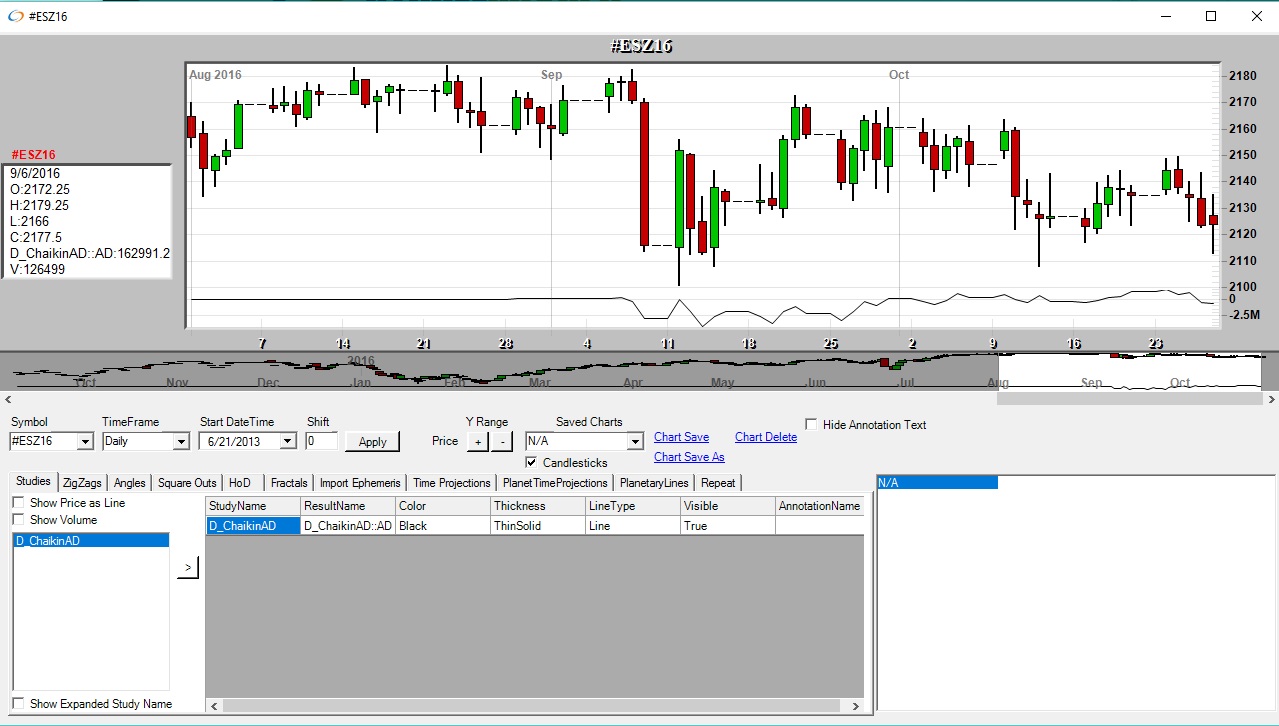
The Chaikin Accumulation Distribution(ChaikinAD) on the daily chart