Kairos™
MACD - Moving Average Convergence Divergence
Moving Average Convergence Divergence (MACD) is the difference between two Exponential Moving Averages. The Signal line is an Exponential Moving Average of the MACD.
The MACD signals trend changes and indicates the start of new trend direction. High values indicate overbought conditions, low values indicate oversold conditions. Divergence with the price indicates an end to the current trend, especially if the MACD is at extreme high or low values. When the MACD line crosses above the signal line a buy signal is generated. When the MACD crosses below the signal line a sell signal is generated. To confirm the signal, the MACD should be above zero for a buy, and below zero for a sell.
Parameters
Period1 - first exponential moving average period
Period2 - second exponential moving average period
Smooth - EMA smoothing period of Major - Minor
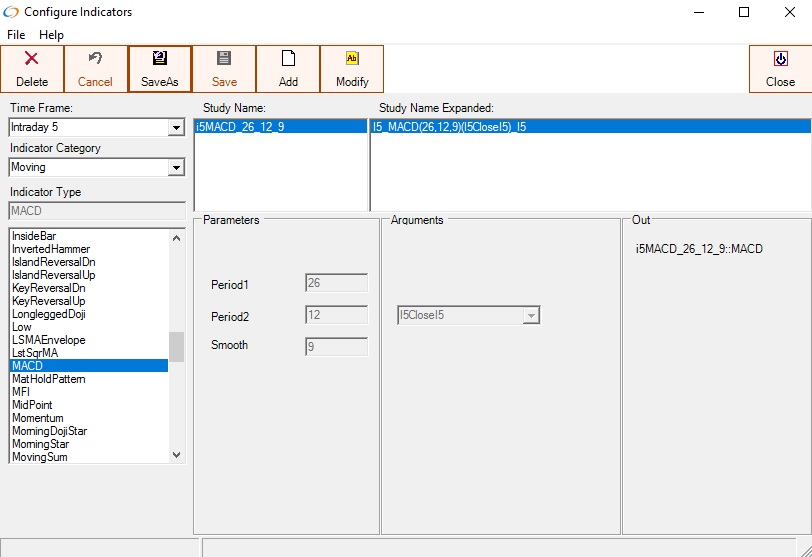
Configuring MACD Major period 26, minor peirod 12, and smoothing period of 9
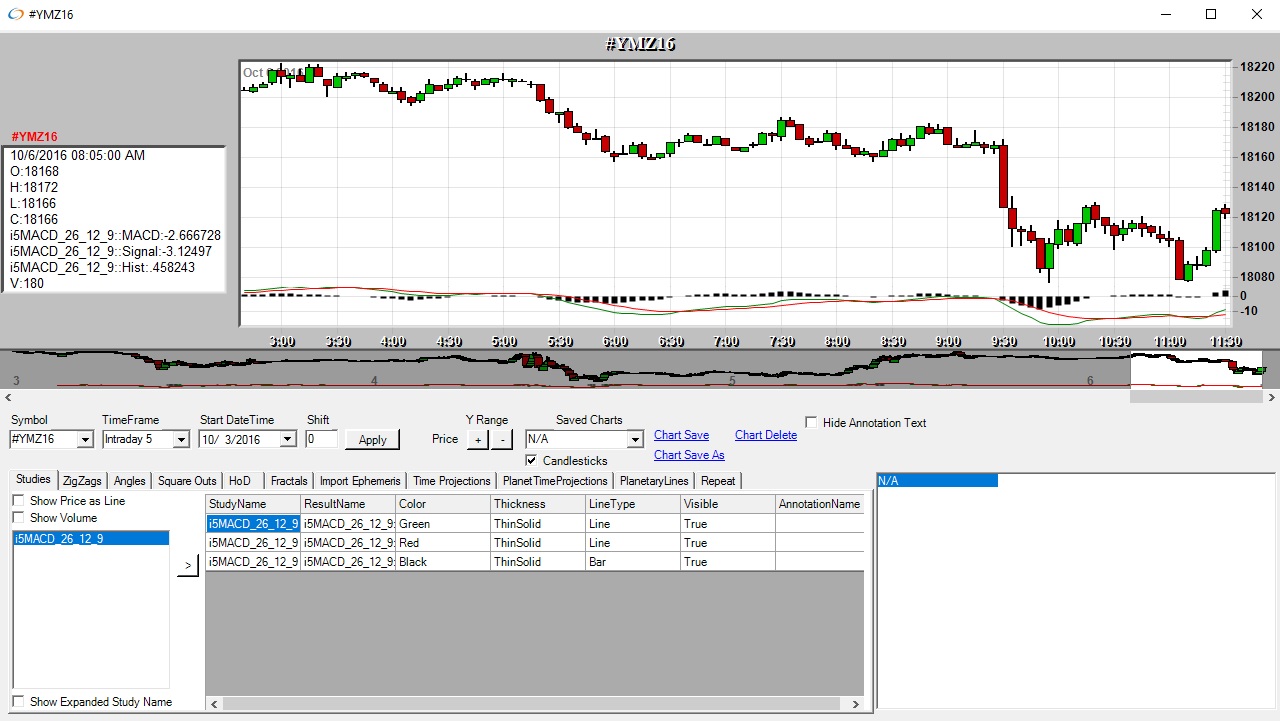
Charting the MACD on a 5 minute Dow mini chart
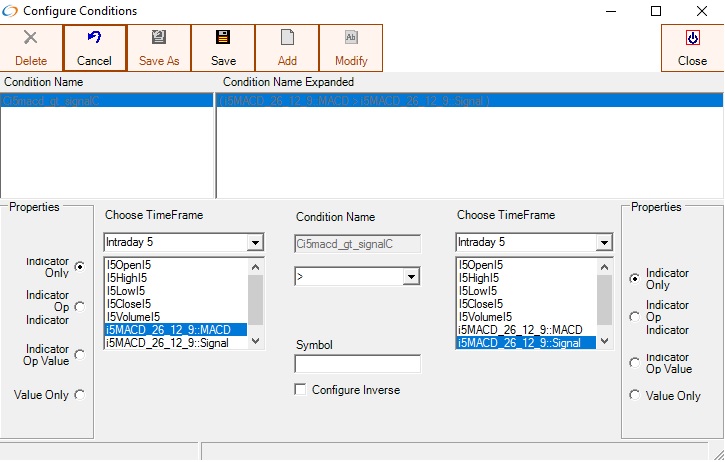
The MACD indicators can be used in conditions