Kairos™
Smart Gap Scanning
Scan the entire universe of equities(over 7500) to find what is in play premarket for the open of trading.
This Gap Scanner can find large cap and over the counter or pink sheet equities you don't have to search multiple sources
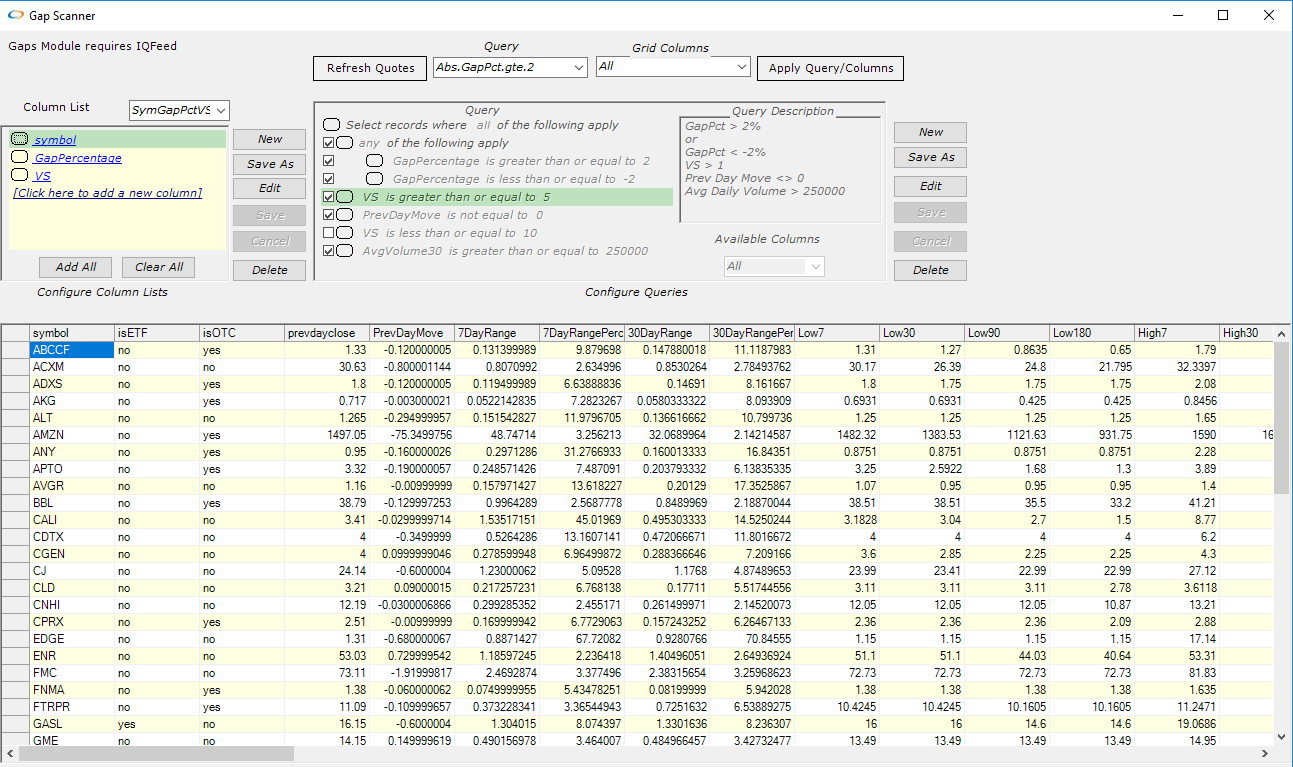
Volume of the gaps only tells you part of the story - the Kairos Smart Gap Scanner tells you the Volume Strength(VS) or the volume relative to it's average daily volume.
When you're quickly analyzing the universe of symbols a quick glance at this the VS will tell you if the move is real.
Now you can add the symbol to your watch list knowing that it has a good chance to continue the move.
Does the equity have earnings today ? No problem - just refer to the Earnings Today(or previous day) Column - no need to search another source and combine data from multiple lists
In fact there are 67 different filters you can customize or you can use one of the pre-defined filter combinations.
It's not enough to know whether a symbol is gapping with volume - where is it with respect to its moving average? Is it above or below the 20, 50 or 200 day moving average, or some combination?
Or what about the 30, 90, or 180 day high ?
The Strong Brk Up filters on symbols above 4 or more moving averages, or above 4 or more significant highs
You can then easily copy the list into the clipboard or to a file, so you can add it to your watchlist without any problems.
Or many times stocks can show unusually high volume activity , with little or no gap - you can scan for this as well with the VolumeStrength filter (VS.gt.10).
You can filter for VS > 5,10, 20 or even higher, so that you can find the equities most likely to fit your criteria and continue to move.
Stop wasting precious time using antiquated volume scans from websites.
Start winning today with the Kairos Smart Gap Scanner.
Here are the pre-configured scans
- Strong Break Ups
- Strong Break Down
- Volume Strength > threshold
- Gaps > or < 2%
Here are the filters where you can configure your own scans - so you can find the symbols that will earn profits, day after day!
- isETF
- isOTC
- Earnings Today
- Earnings P(revious) Day
- Volume
- Average Daily Volume(30 and 65)
- Volume Strength(VS)
- VS * GapPct
- Abs(VS * GapPct)
- 7 Day Range(Price and Percent)
- 30 Day Range(Price and Percent)
- Gap Percent(Today and 5 previous days)
- Percent Move(Previous 5 days)
- Above or Below Moving Average ( 3,6,10,20,50,100,200)
- MAUpCnt - total of moving averages price is above
- MADnCnt - total of moving averages price is below
- Below Important Price Levels(7,30,90,180 day lows)
- Above Important Price Levels(7,30,90,180 day highs)
- BrkDnCnt - count of Price Levels it is below
- BrkUpCnt - count of Price Levels it is above