Kairos™
UD1,UD2,UD3,UD4 - User Defined Indicators
User Defined Indicators(UDX) can be used with Daily or Intraday timeframes, and can be used to import values from csv files in order to be used as pivots used by conditions, or to display projected curves into the future.
User Defined Indicators allow you to import values from csv files into Kairos and to form conditions based on the imported values. For example, if you have a set of pivots that you want to trigger entries and exits from, you can use the User Defined indicators to import the pivots. As you add data to the csv files, the new values are automatically imported up, making it easy to add new pivots each day for new levels each day. Just modify the csv file with the new indicators. Each UD indicator can also be used to import a csv projection file, which will display projected values on the chart in the future.
Importing Buy/Sell Values
- Annt1 - display annotations on the chart at specific times
- UD1 - User Defined csv file with one data column
- UD2 - User Defined csv file with two data columns
- UD3 - User Defined csv file with three data columns
- UD4 - User Defined csv file with four data columns
User Defined Indicators are used with the "Import User Defined Forecasts" window(found from the Import->Projections), which is how they are associated with a csv file.
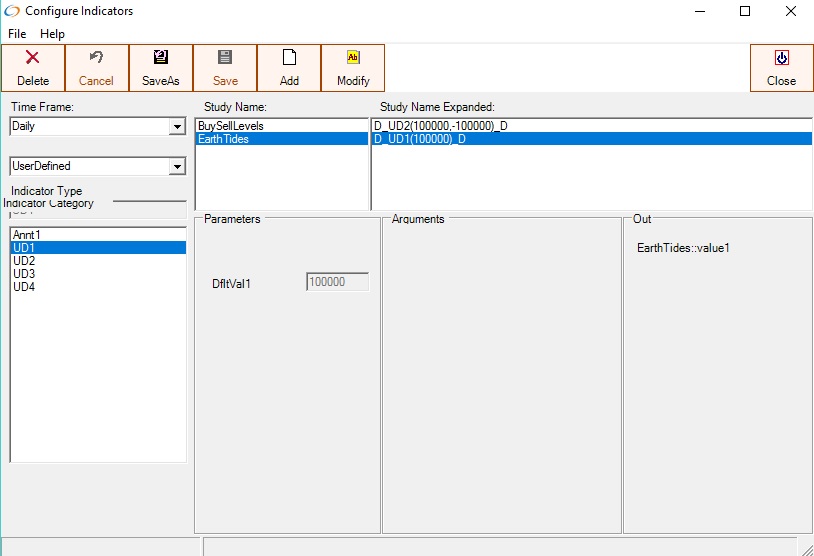
Step 1 - Configure the User Defined indicator
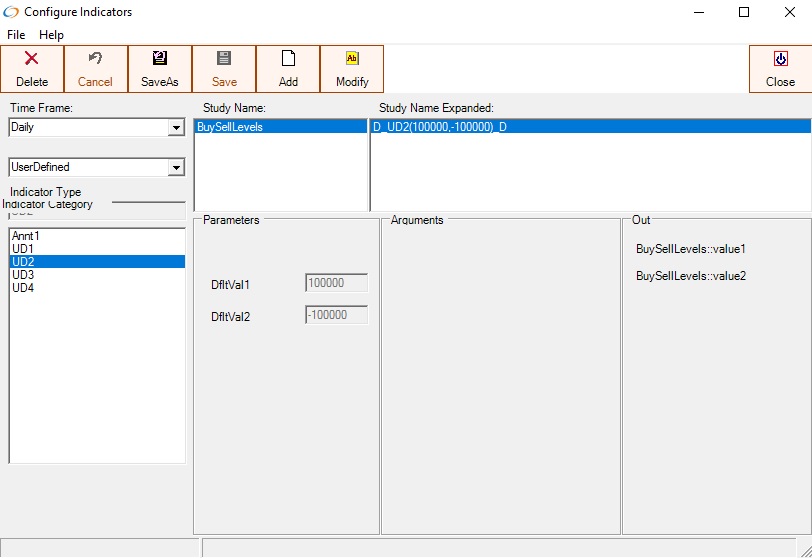
In this example, a User Defined indicator with 2 inputs is needed,one for the buy level and one for the sell level, meaning the csv file referenced will need at least 3 columns, 2 for the buy/sell levels and 1 for the date column. Since 2 input columns are needed, the UD2 indicator is used. In the image above, a UD2 indicator named "BuySellLevels" is configured. The parameter values configured(DfltVal1 and DfltVal2) are used if there are no rows in the csv file for any date. The Buy level should be the first value configured and the sell value the second value. This way, if a row for a particular date is missing in the csv file, the buy value will default to 100000, and the and any condition that contains the BuyLevel will not be activated(because 100000 is higher than any buy level of a market). The sell default level is set to -100000.
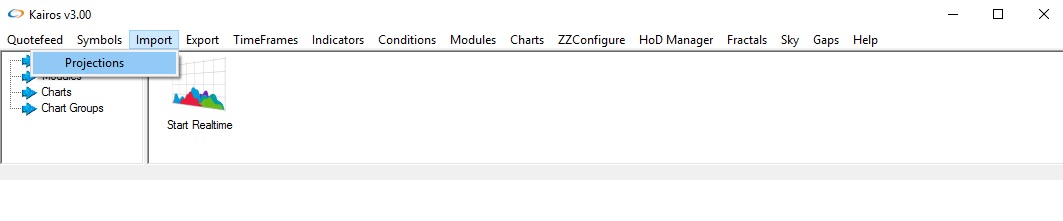
Select Import->Projections ,in order to associate the User Defined indicator with a CSV file.
Every User Defined indicator configured will be available in the "Import User Defined Forecasts" window. This window can be used to import csv files for Buy/Sell levels(or other criteria),for use in conditions, or to import future projection values that can be displayed in charts(the EarthTides projections are an example of this).
Records can be added to a User Defined indicator one of two ways, by pressing the New(All Symbols) or New buttons.
When New(All Symbols) button is selected, only one row is configured for the User Defined Indicator and is intended to be used when a csv file is to be charted on every symbol. For example,it would be used if you want to chart the S&P against all symbols.
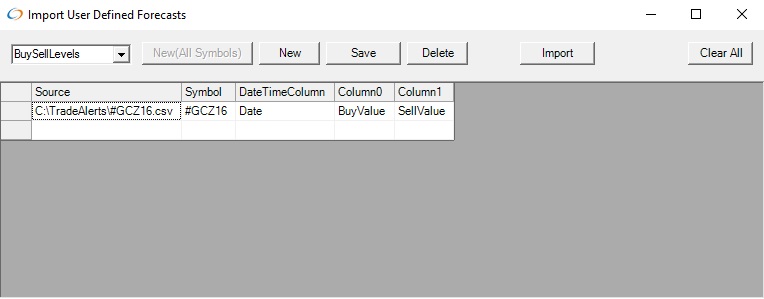
When the New button is used, one csv file for each symbol is configured
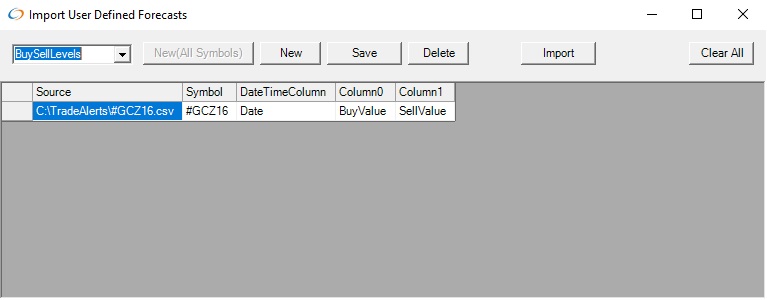
This shows one csv file configured for each symbol. the File #GCZ16.csv is associated with the symbol #GCZ16
Contents of #GCZ16.csv
Date,BuyValue,SellValue
11/17/2016,1227.41,1224.75
11/18/2016,1225.54,1214.21
11/21/2016,1212.96,1206.32
BuyValue column is associated with column0 and SellValue column is associated with column1
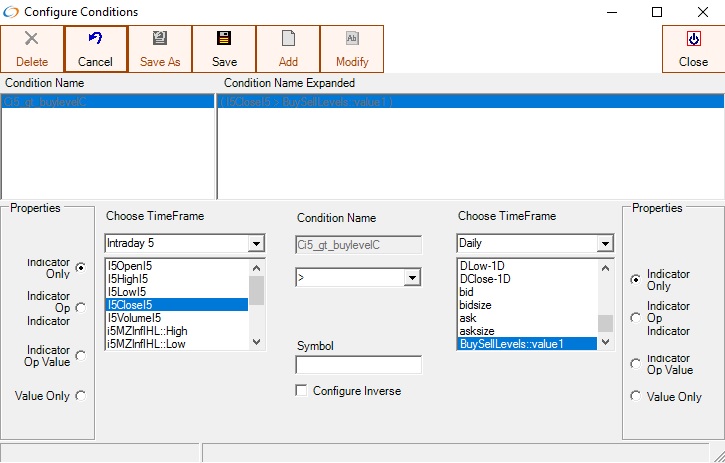
The condition above named i5_gt_buylevel is configured to alert when the intraday 5 minute close is greater than the imported Buy Level. This condition can then be used in a Trading System module.
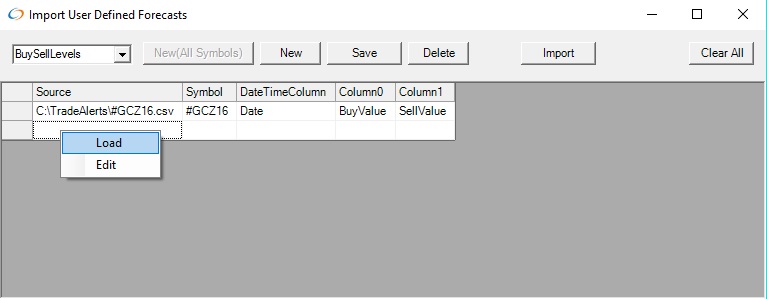
To add Buy Sell levels for Beans, add a new row by pressing the "New" button
Right click on the first column and select "Load" to select a csv file
This is the contents of #SF17.csv file
Date,BuyValue,SellValue
11/17/2016,993.48,985.22
11/18/2016,991.94,982.91
11/21/2016,994.5,987.5
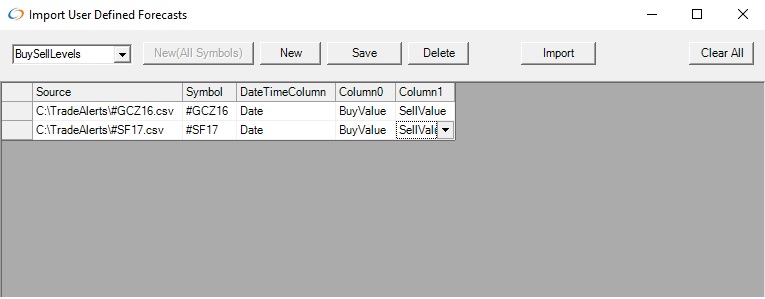
The user selects the symbol in Kairos(#SF17), the Date column, and the columns to associate with Column0(BuyValue) and Column1(SellValue)
Important - the rows of the CSV file selected need to have the same timeframe as configured in the User Defined indicator or the file cannot be imported.
Press the Save button and then the Import button. Pressing the Import button will tell you the success or failure of importing the file. When Kairos is restarted, any new values configured in the CSV files configured in this window will automatically be imported.
Importing Projections
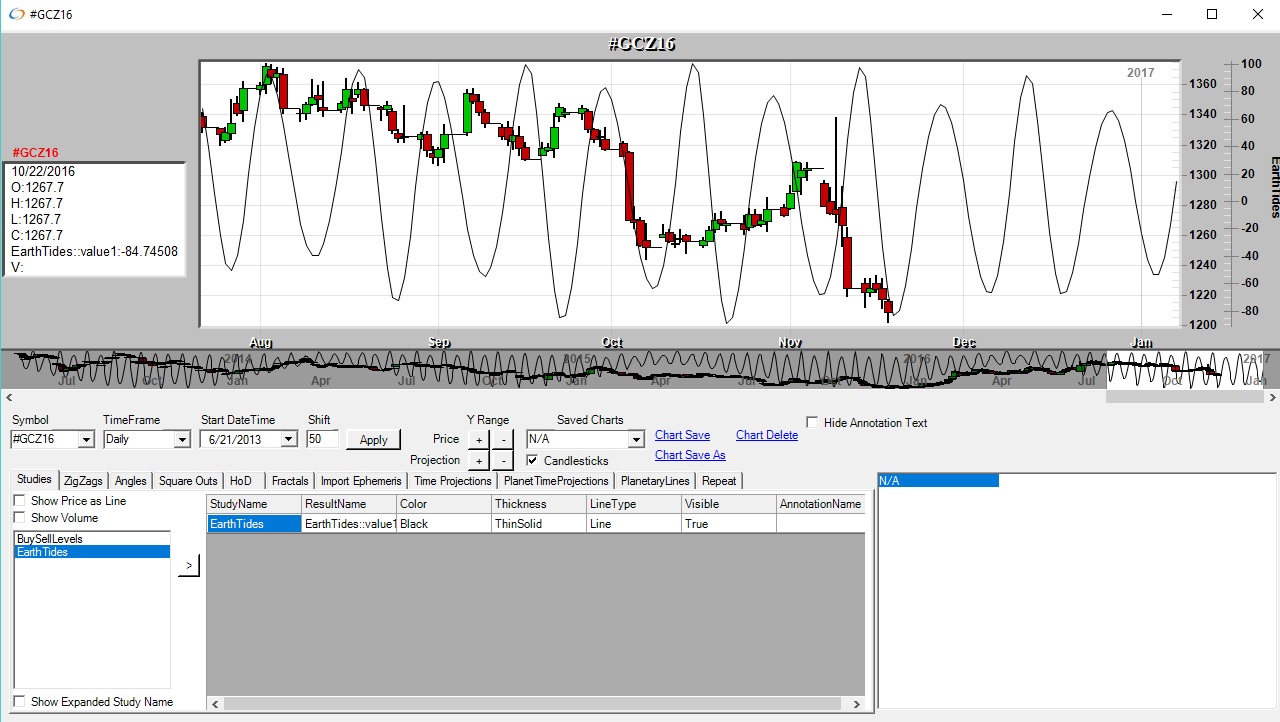
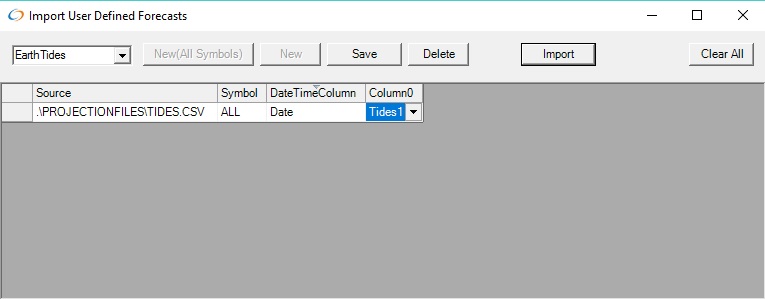
UD1 (User Defined with 1 date and 1 column ) is configured on the Daily Timeframe
A row is added using the "New(All Symbols)" button. The source CSV file is selected by right clicking in the source column, selecting Load and navigating to the file. Then the DateTime Column and the Tides1 column are selected. After Pressing Save, Import is pressed to import the data
The EarthTides projection is displayed on the charts by selecting the EarthTides indicator. The Shift parameter is set to 50 to show the projected values in the future.