Kairos™
DX - Directional Movement Index
The DX is usually smoothed with a moving average (i.e. the ADX). The values range from 0 to 100, but rarely get above 60. To interpret the DX, consider a high number to be a strong trend, and a low number, a weak trend.
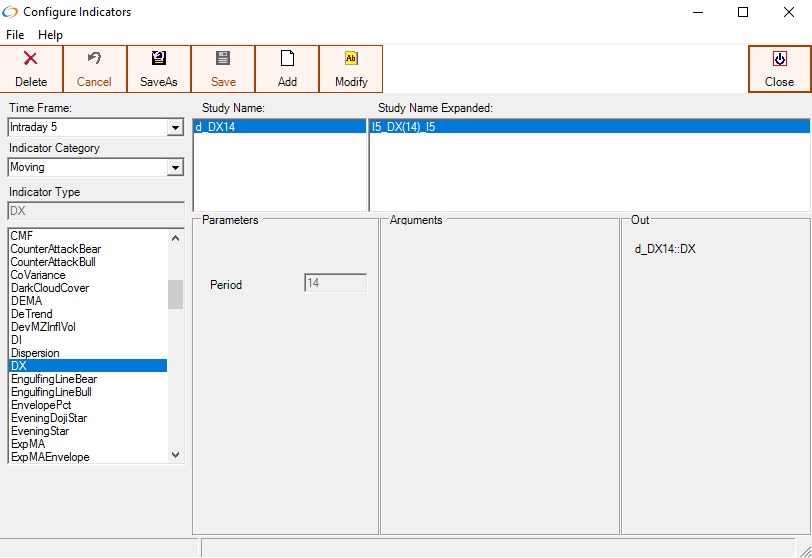
Directional Movement Index(DX) with a period of 14
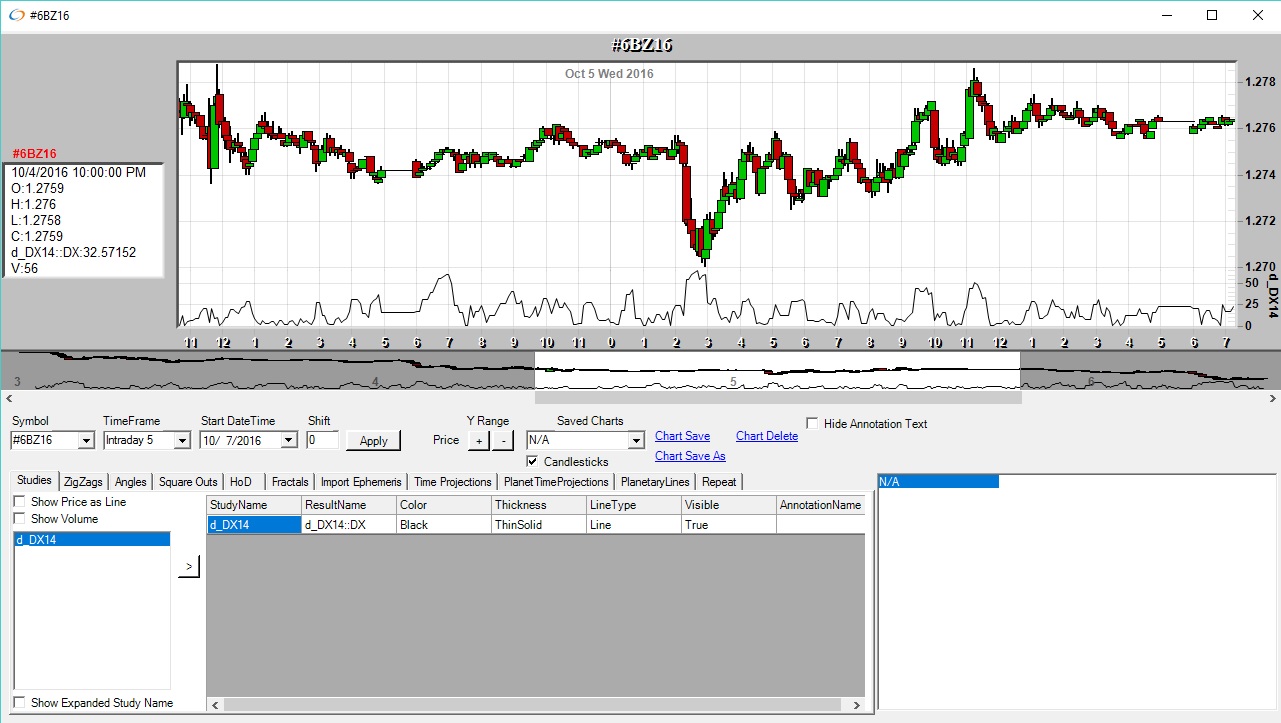
Directional Movement Index(DX) Chart with a period of 14
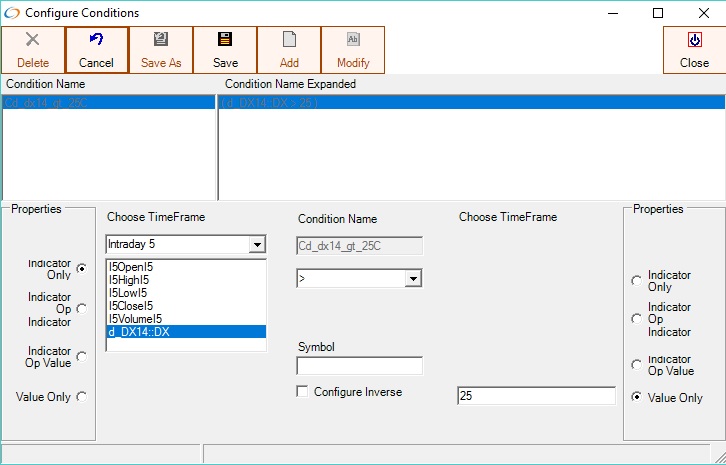
The Directional Movement Index(DX) indicator can be used in conditions