Kairos™
Bollinger - Bollinger Bands
Bollinger Bands consist of three lines. The middle band is a simple moving average of the typical price (TP). The upper and lower bands are F standard deviations (generally 2) above and below the middle band. The bands widen and narrow when the volatility of the price is higher or lower, respectively.
Bollinger Bands do not, in themselves, generate buy or sell signals; they are an indicator of overbought or oversold conditions. When the price is near the upper or lower band it indicates that a reversal may be imminent. The middle band becomes a support or resistance level. The upper and lower bands can also be interpreted as price targets. When the price bounces off of the lower band and crosses the middle band, then the upper band becomes the price target.
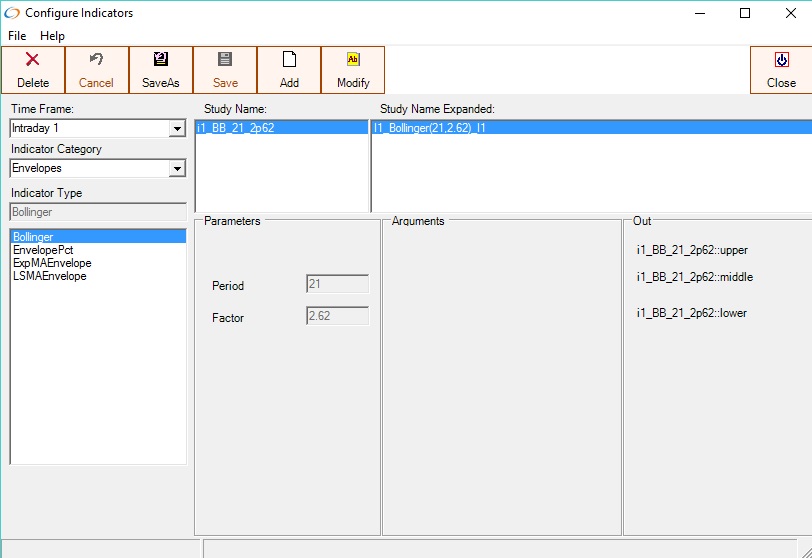
The Bollinger band indicator with a period of 21 and a factor of 2.62 on the minute timeframe.
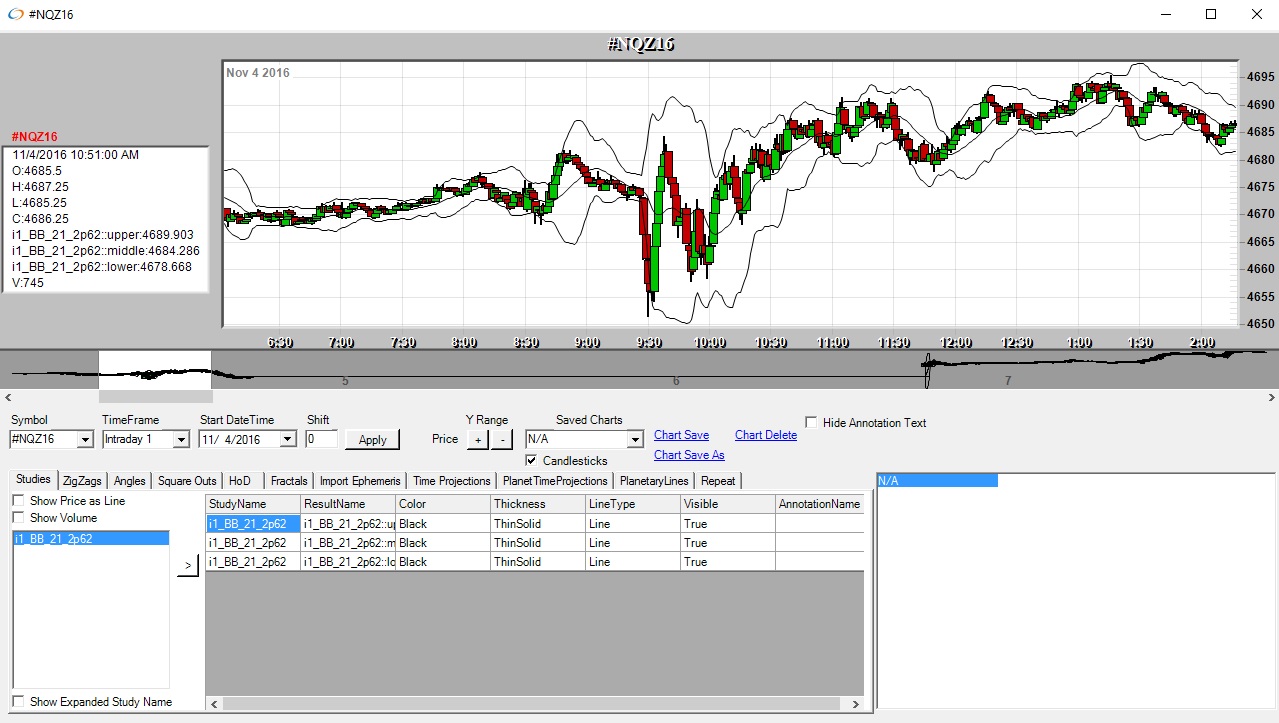
Bollinger Band indicator charted on the 1 minute timeframe