Kairos™
RSI - Relative Strength Index
The Relative Strength Index (RSI) calculates a ratio of the recent upward price movements to the absolute price movement. The RSI ranges from 0 to 100. The RSI is interpreted as an overbought/oversold indicator when the value is over 70/below 30. You can also look for divergence with price. If the price is making new highs/lows, and the RSI is not, it indicates a reversal.
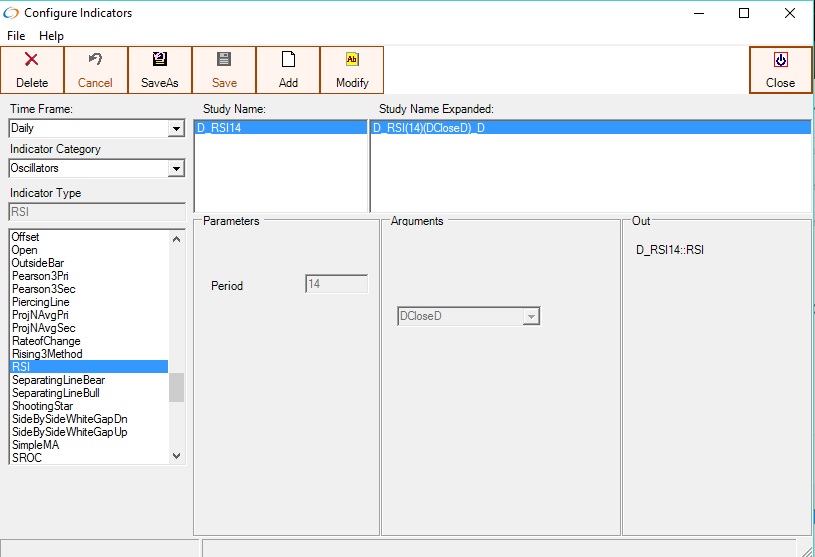
Relative Strength Index (RSI) on the Daily Timeframe, with a Period of 14
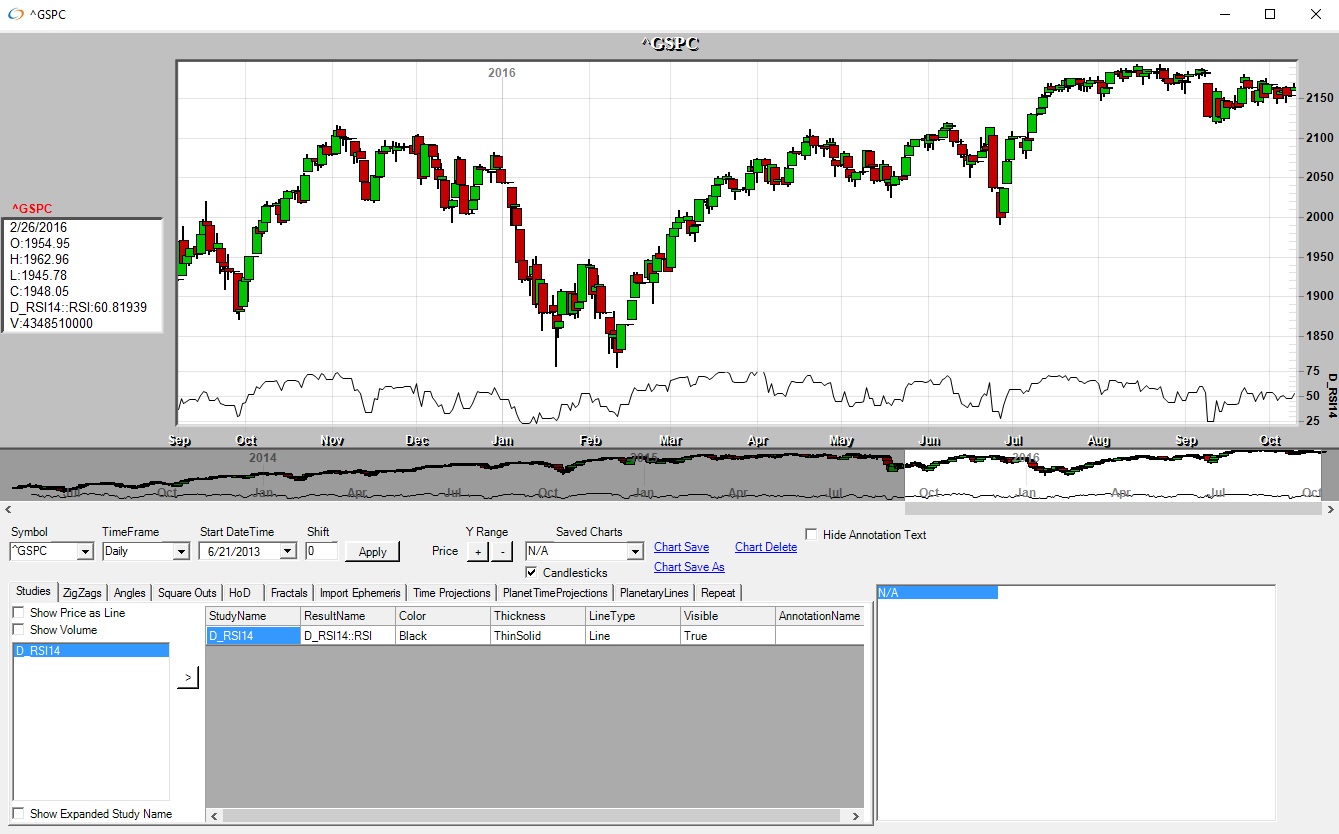
Relative Strength Index (RSI) displayed on a daily chart of ^GSPC
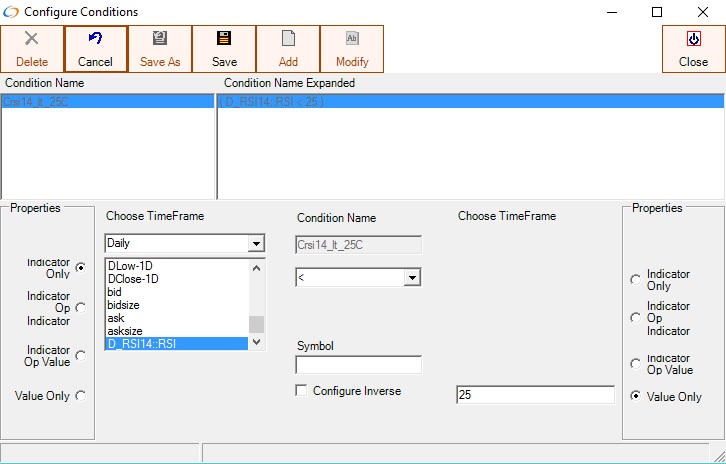
The Relative Strength Index Indicator (RSI) can be used in conditions