Kairos™
Money Zone Inflection Volume High Low - MZInflVolHL
This indicator is a type of Market Profile analysis. It finds the prices where volume activity peaks in the previous trading day. You can specify how many market days to include in the analysis, and how many days to process. There is also a threshold that can be specified(must be between 1 and 100), which filters out any inflections that are not strong.
The 6 strongest volume inflections are calculated that are stronger than the PctThld specified. If there are less than 6 inflections that meet the PctThld criteria, then only the inflections that are above the threshold are calculated.
This indicator calculates the same inflections as the MZInflVol indicator The MZInflVol indicator displays the inflections based on the strength of the indicator, while the MZInflVolHL displays the highest and lowest inflections first, second highest and second lowest inflections, and then the strongest inflection. This is useful when developing buy and sell criteria.
This indicator is used on Intraday Timeframes, and cannot be used on Daily, Weekly or Monthly timeframes.
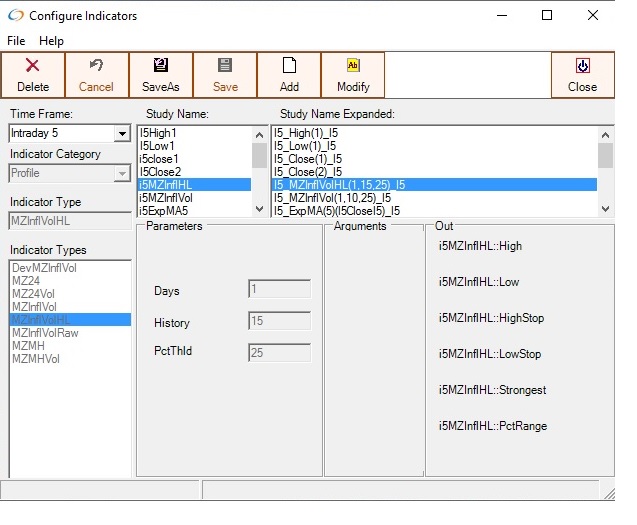
Input Parameters
- Days – number of prior market days to process. Recommended setting 1 or 2
- History – number of market days to process. Recommended setting 15, to go back 2 weeks
- PctThld – percent threshold inflection is not included unless the daily volume of the inflection contains at least this amount of the cumulative volume for the day. Used to filter out weak inflection lines. Recommended setting 25.
Output Indicators
- High – Extreme high volume inflection price
- Low – Extreme low volume inflection price
- HighStop – 2nd highest volume inflection price
- LowStop – 2nd lowest volume inflection price
- Strongest – Inflection that has the highest volume – can be the same line as High, Low, HighStop, or Low Stop
- PctRange – 100 X ( High – Low) / High
Chart of MZInflVolHL applied to NQ
When displayed on the chart, the High shown as green, Low is shown as red. HighStop and LowStop are shown as dashed lines. The Strongest line is shown as a thick black line. If the Strongest line is the same as the High or Low, the color is shown as black, instead of green or red.
