Kairos™

Market Profile or Money Zone(MZ) Indicators

The Money Zone(MZ) indicators are based on the Market Profile. The MZ indicators calculate the price level where there most price activity has occurred ( called the Point of Control or POC) within a given time, usually the previous day, but it can be for 2 or more days.  


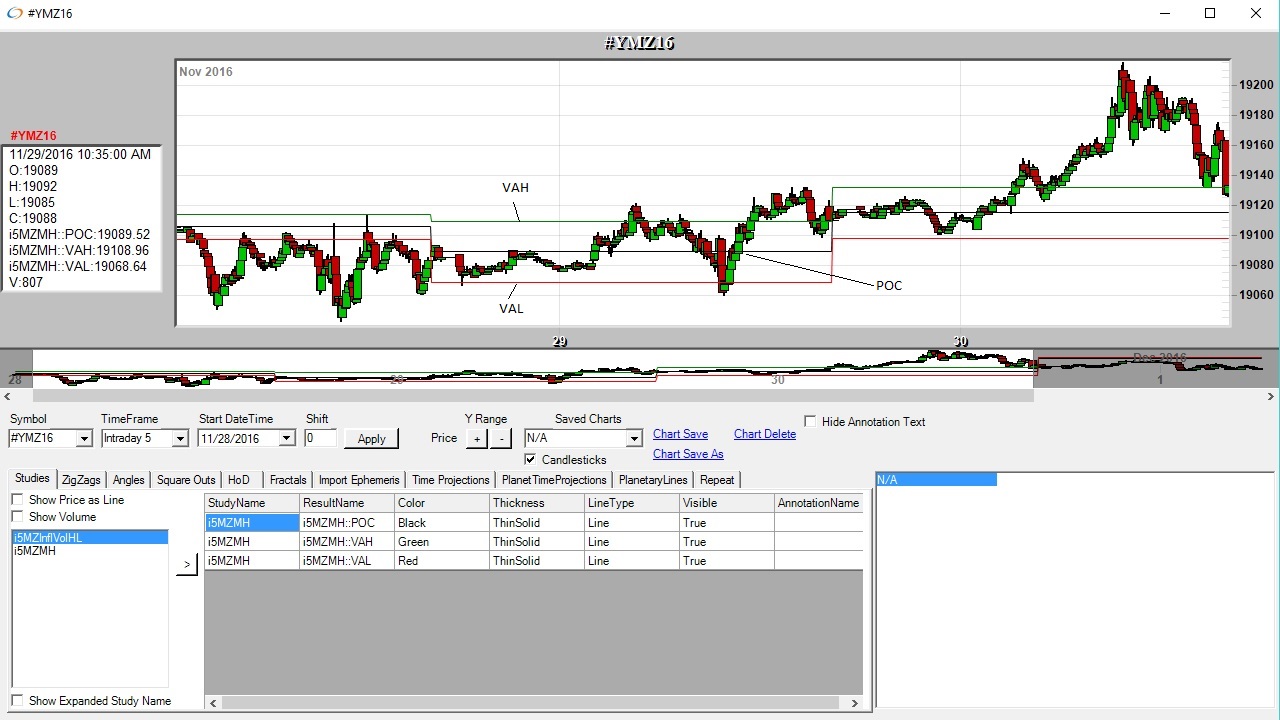
From the POC, the window containing 70% of the price activity is determined.  The high of this area is the Value Area High(VAH) and the low is the VAL.  This chart shows the MZMH, which determines the MZ levels based on the price activity during Market Hours(MH).  

A recommended book on Market Profile is "Secrets of a Pivot Boss", by Franklin Ochoa.  Another one can be found on the CMEGroup website - Market Profile Handbook.   

There are 6 different MZ indicators.  The Market Hours(MH) indicators base the levels on the price activity during market hours.  The '24' indicators base the levels on price activity during the previous 24 hours of price activity.  The 'Infl' indicators are a derivative of the Profile indicators and are based only on volume inflections, thresholds can be set for the strength of the inflections.  The levels calculated can be used in conditions and trading systems.  

  • MZ24 - Money Zone 24 hours based on price
  • MZ24Vol - Money Zone 24 hours based on Volume
  • MZInflVol - Money Zone 24 hours based on Volume Inflections( Strongest to weakest)
  • MZInflVolHL - Money Zone 24 hours based on Volume Inflections ( Highest to Lowest)
  • MZMH - Money Zone  based on price during Market Hours
  • MZMHVol - Money Zone based on volume during Market Hours
Text/HTML


Money Zone Inflection Volume High Low - MZInflVolHL 

This indicator is a type of Market Profile analysis. It finds the prices where volume activity peaks in the previous trading day. You can specify how many market days to include in the analysis, and how many days to process. There is also a threshold that can be specified(must be between 1 and 100), which filters out any inflections that are not strong.


Money Zone Market Hours - MZMH 

This indicator is a type of Market Profile analysis. It finds the levels where the most price activity occurred during the previous trading day during the primary session of the instrument. You can specify how many market days to include in the analysis, and how many days to process.


Money Zone 24 hours - MZ24 

This indicator is a type of Market Profile analysis. It finds the levels where the most price activity occurred during the previous trading day for the last 24 hours of trading of the instrument. You can specify how many market days to include in the analysis, and how many days to process.


Money Zone Market Hours Volume - MZMHVol 

This indicator is a type of Market Profile analysis. It finds the levels where the most volume activity occurred during the previous trading day during the primary session of the instrument. You can specify how many market days to include in the analysis, and how many days to process.


Money Zone 24 hours on Volume - MZ24Vol 

This indicator is a type of Market Profile analysis. It finds the levels where the most volume activity occurred during the previous trading day for the last 24 hours of trading of the instrument. You can specify how many market days to include in the analysis, and how many days to process.


Money Zone Inflection on Volume - MZInflVol 

This indicator is a type of Market Profile analysis. It finds the prices where volume activity peaks in the previous trading day. You can specify how many market days to include in the analysis, and how many days to process. There is also a threshold that can be specified(must be between 1 and 100), which filters out any inflections that are not strong. The 6 strongest volume inflections are calculated that are stronger than the PctThld specified. If there are less than 6 inflections that meet the PctThld criteria, then only the inflections that are above the threshold are calculated.