Kairos™
Aroon
The Aroon indicator attempts to show when a new trend is beginning. The indicator consists of two lines (Up and Down) that measure how long it has been since the highest high/lowest low has occurred within an n period range.
When the Aroon Up is staying between 70 and 100 then it indicates an upward trend. When the Aroon Down is staying between 70 and 100 then it indicates an downward trend. A strong upward trend is indicated when the Aroon Up is above 70 while the Aroon Down is below 30. Likewise, a strong downward trend is indicated when the Aroon Down is above 70 while the Aroon Up is below 30. Also look for crossovers. When the Aroon Down crosses above the Aroon Up, it indicates a weakening of the upward trend (and vice versa).
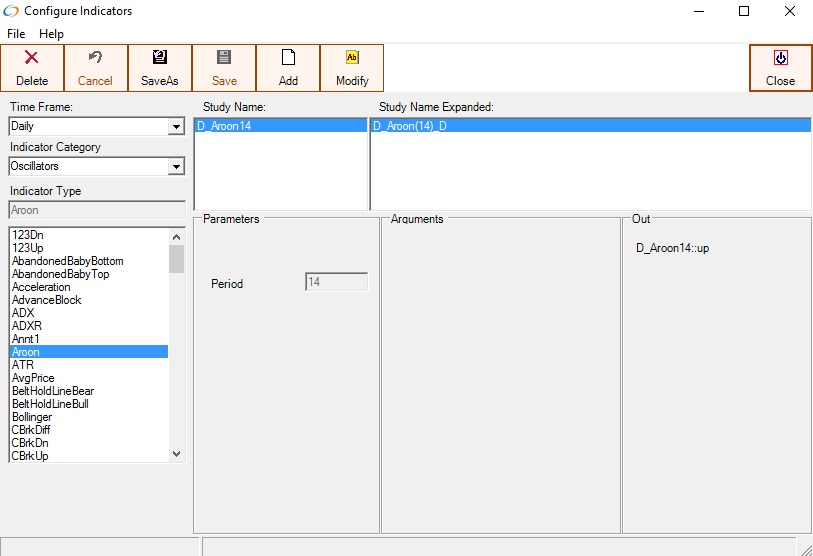
The Aroon indicator on the daily chart Timeframe, Period = 14
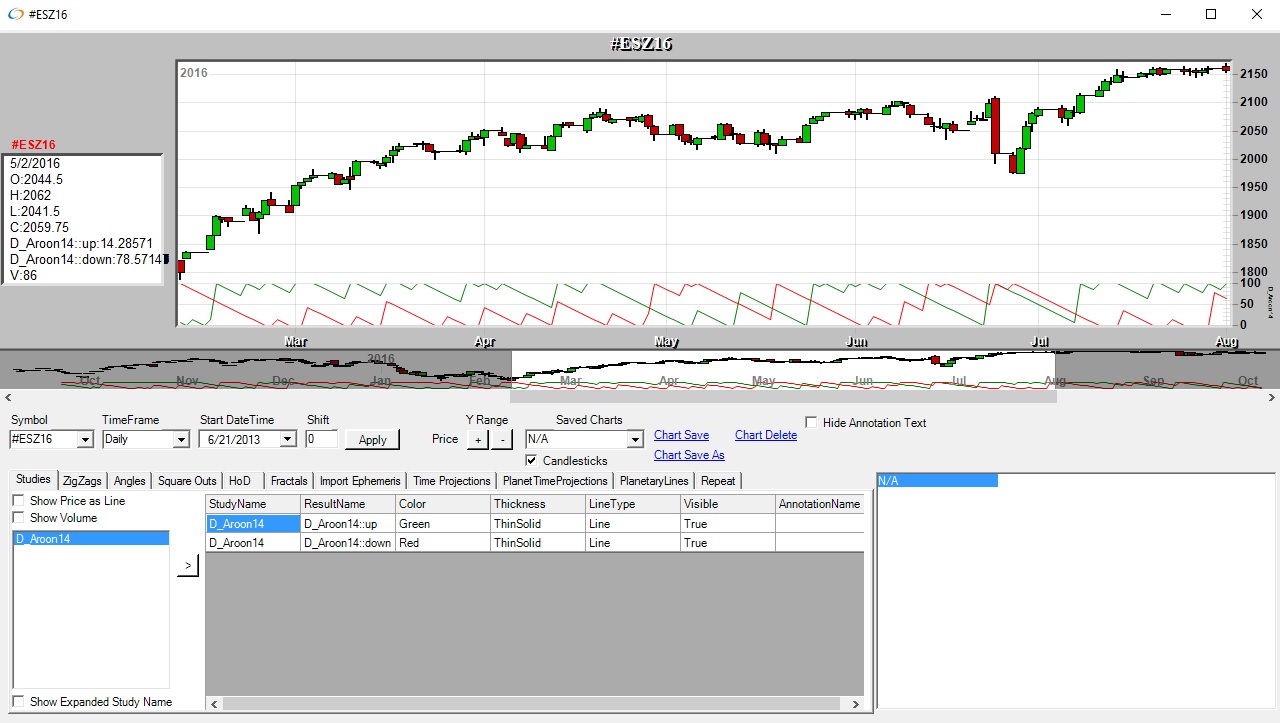
Aroon Indicator on the daily chart
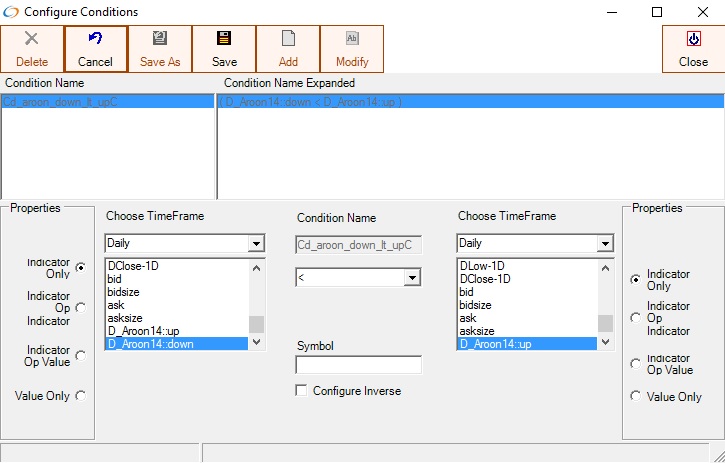
The Aroon Indicator can be used in conditions