Kairos™
DI - Directional Index
The +DI is the percentage of the true range that is up. The -DI is the percentage of the true range that is down. A buy signal is generated when the +DI crosses up over the -DI. A sell signal is generated when the -DI crosses up over the +DI. You should wait to enter a trade until the extreme point is reached. That is, you should wait to enter a long trade until the price reaches the high of the bar on which the +DI crossed over the -DI, and wait to enter a short trade until the price reaches the low of the bar on which the -DI crossed over the +DI.
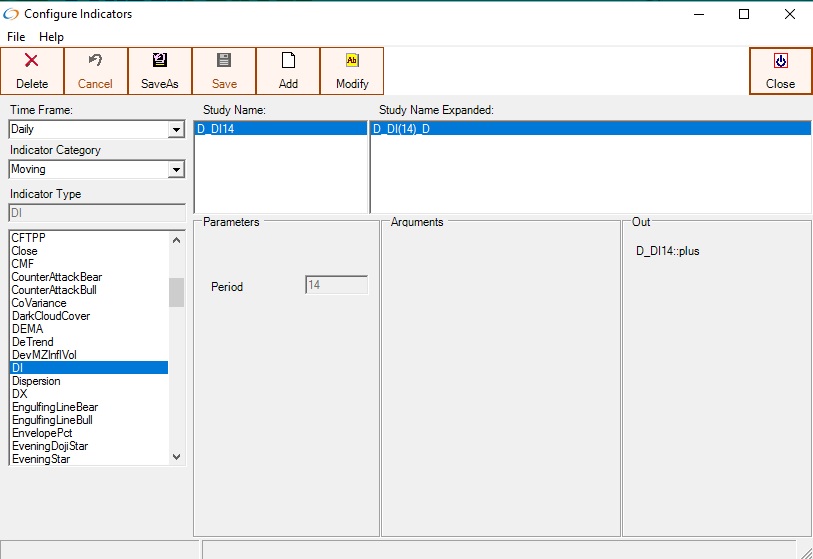
Directional Index(DIPlus, DIMinus) with a period of 14
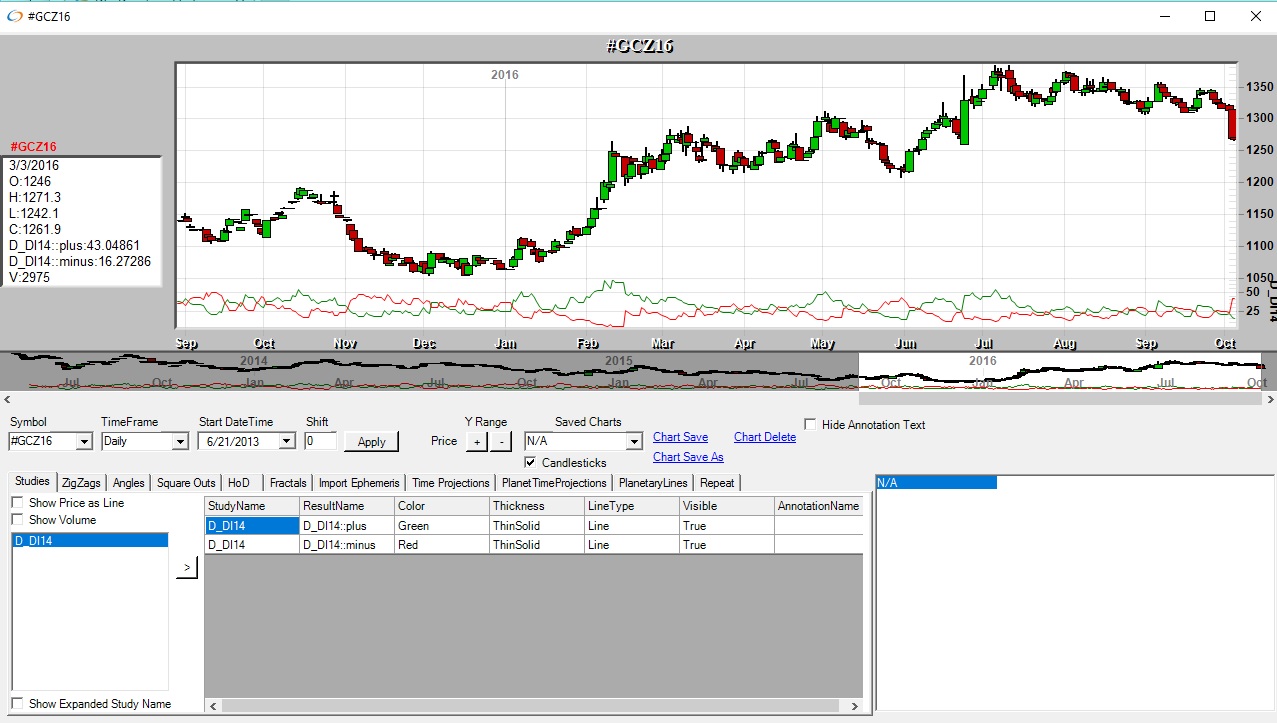
Directional Index(DIPlus, DIMinus) chart with a period of 14
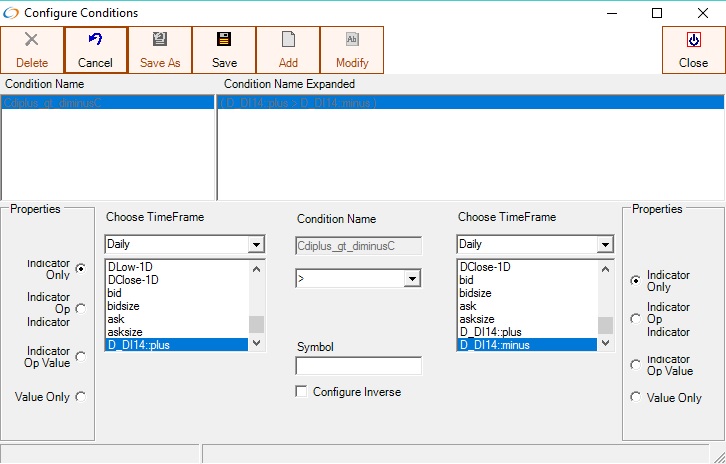
The Directional Index(DI) indicator can be used in conditions