Kairos™
TRIX - Rate of Change of Triple Exponential Moving Average
The TRIX indicator calculates the 1 day rate of change of a triple exponential moving average. The values oscillate around zero. Buy/sell signals are generated when the TRIX crosses above/below zero. An exponential moving average of the TRIX can be used as a signal line. A buy/sell signals are generated when the TRIX crosses above/below the signal line and is also above/below zero.
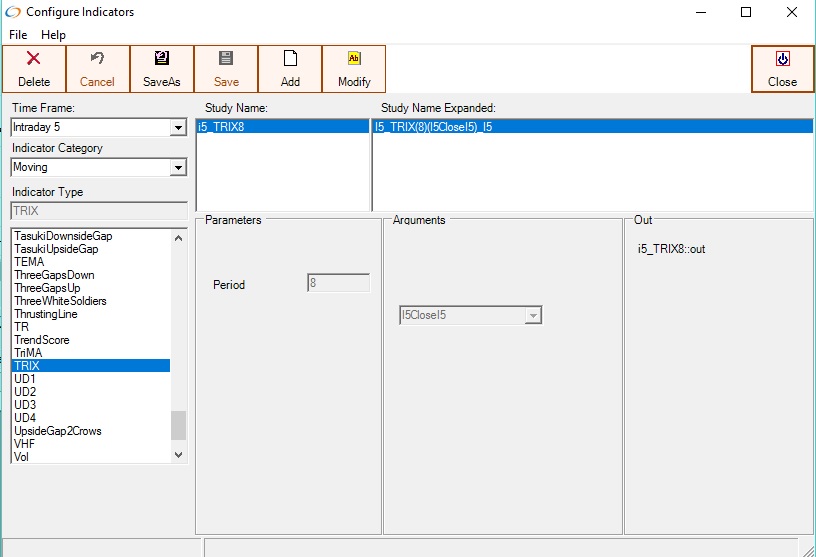
TRIX configuration with a period of 8
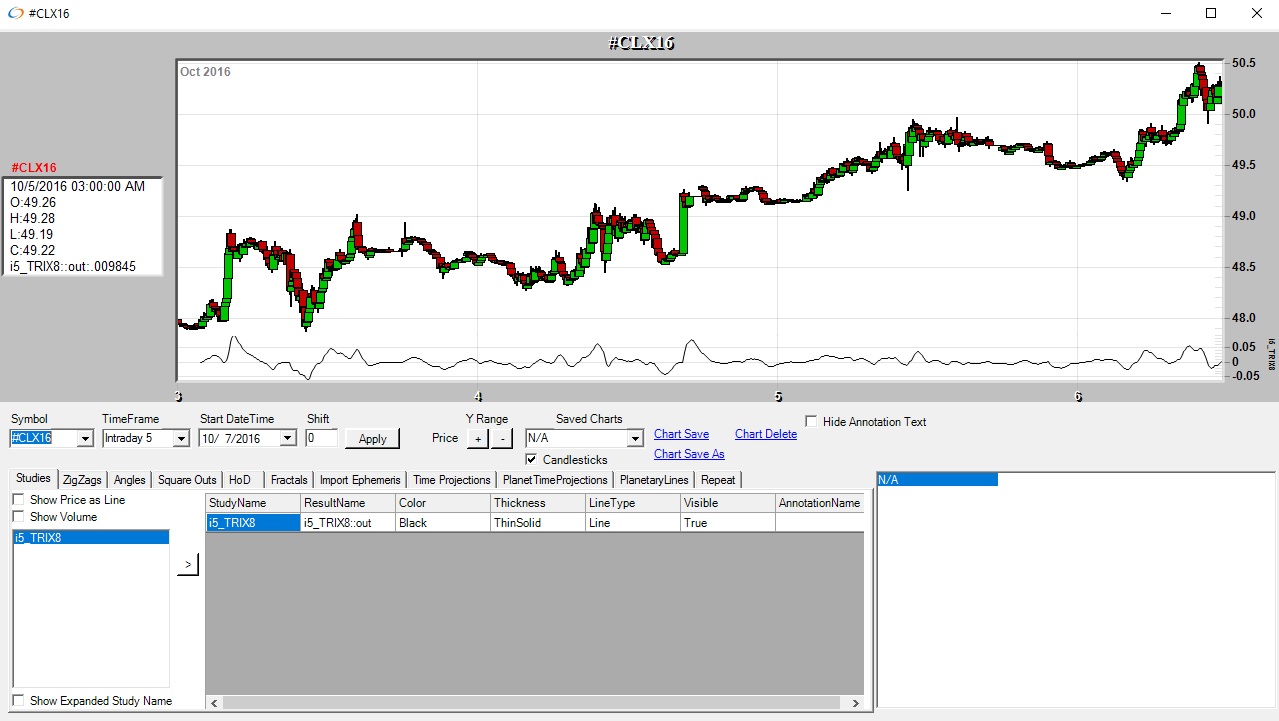
TRIX Chart with a period of 8
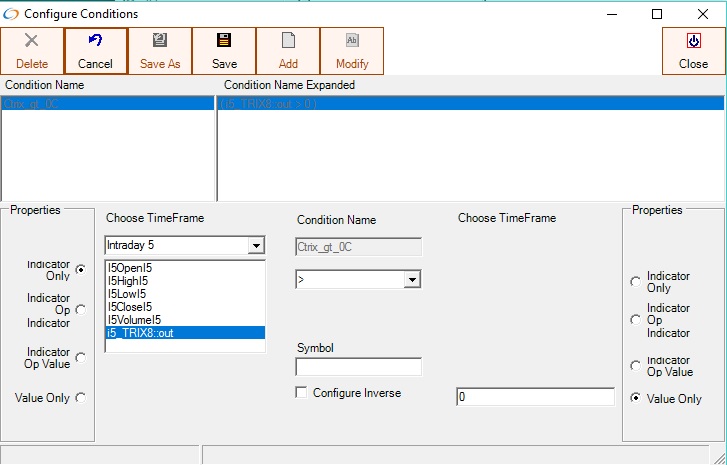
The TRIX indicator can be used in conditions