Kairos™
Williams %R
The Williams %R is similar to an unsmoothed Stochastic %K. The values range from zero to 100, and are charted on an inverted scale, that is, with zero at the top and 100 at the bottom(values are multiplied by -1). Values below 20 indicate an overbought condition and a sell signal is generated when it crosses the 20 line. Values over 80 indicate an oversold condition and a buy signal is generated when it crosses the 80 line.
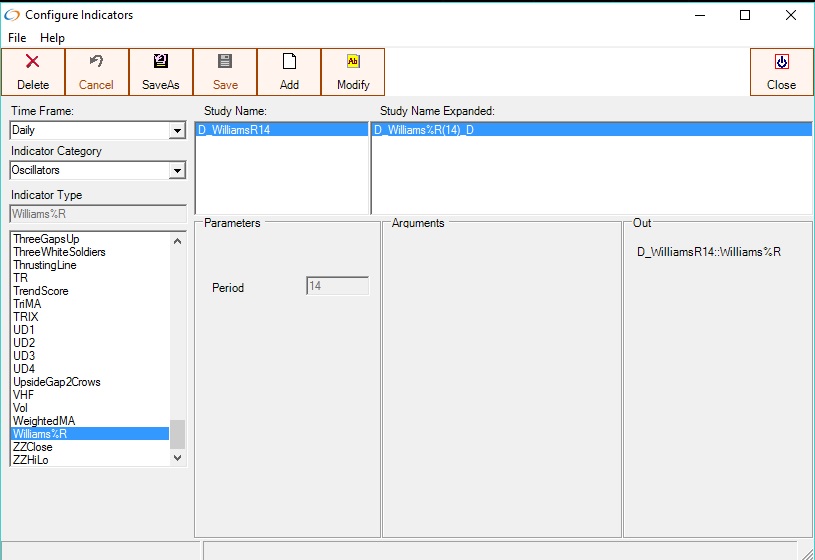
Williams %R on the Daily Timeframe, with a Period of 14
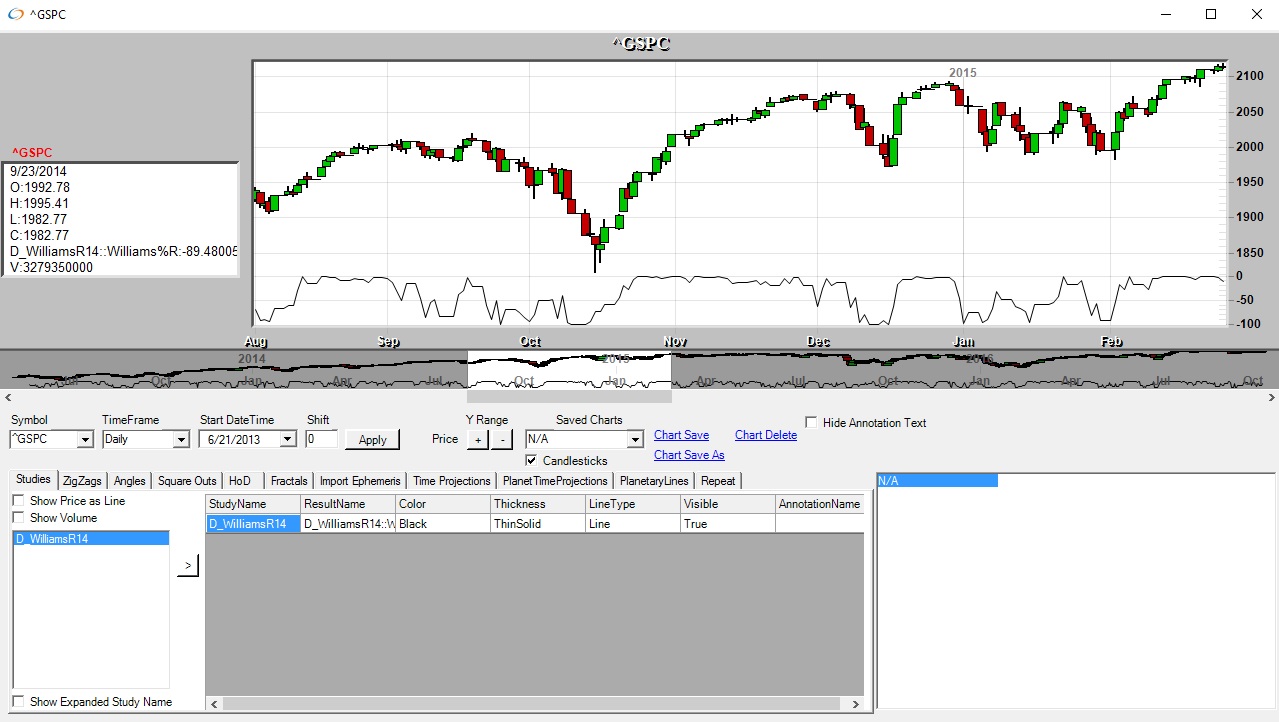
Williams %R displayed on a daily chart of ^GSPC
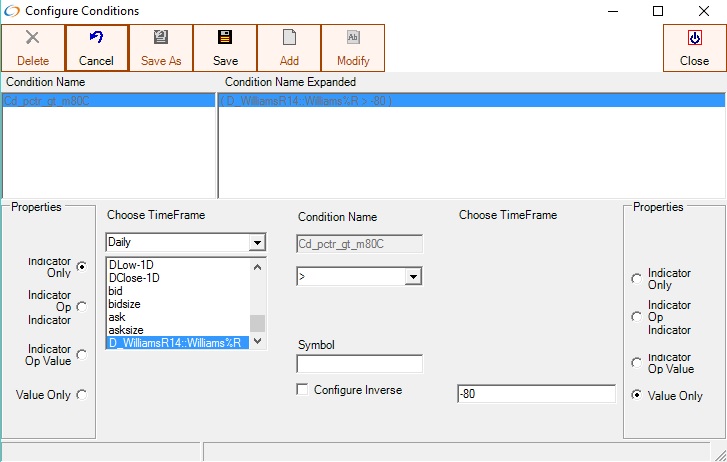
Williams %R can be used in conditions