Kairos™

Indicators

There 100+ indicators available these categories


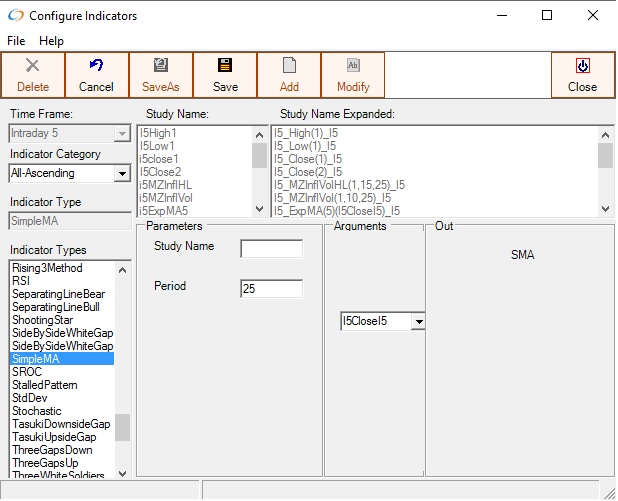
Step 1 Select the Timeframe you wish to configure the indicator on. You can select any timeframe that's configured in the "TimeFrames" window

Step 2 Press The Add Button to Add a study

Step 3  Select the indicator. Each study has it's its unique Parameters, Arguments and OutputIndicators

Step 4    Select a studyname, which must be unique throughout the Stormtracker configuration

Step 5   Press Save and you will see the indicator name and the expanded name, which is a shorthand for the study configured

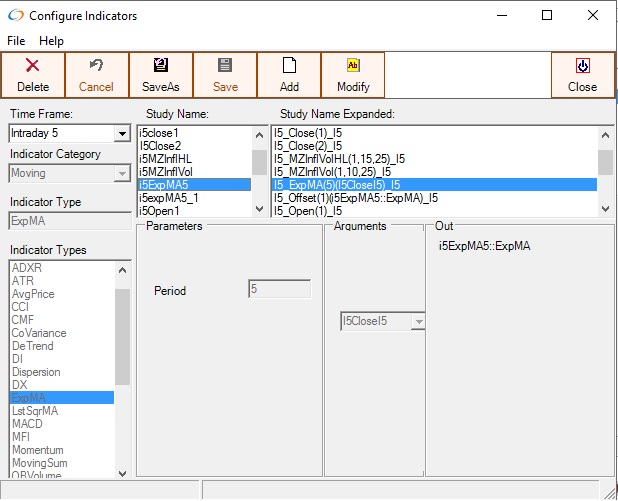
The Output indicators, on the right side, will be available for use when configuring conditions


Market Profile or Money Zone(MZ) Indicators 

The Money Zone(MZ) indicators are based on the Market Profile. The MZ indicators calculate the price level where there most price activity has occurred ( called the Point of Control or POC) within a given time, usually the previous day, but it can be for 2 or more days.


UD1,UD2,UD3,UD4 - User Defined Indicators 

User Defined Indicators(UDX) can be used with Daily or Intraday timeframes, and can be used to import values from csv files in order to be used as pivots used by conditions, or to display projected curves into the future.


Predefined Indicators 

Some commonly used daily indicators can be found in the Configure Conditions window


ZigZags 

ZigZags can be configured two different ways - through the ZigZagConfigure window and the Configure Indicator window.


Developing Custom Indicators 

Custom indicators can be developed in C or C#, for import into the Kairos platform.